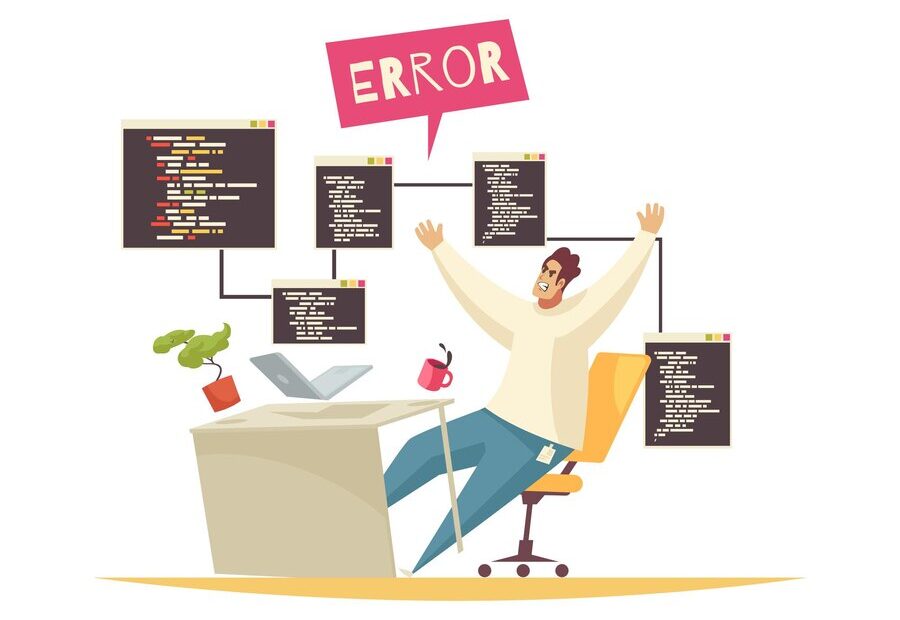
Debug An Error is a crucial skill for any developer. It’s the process of identifying and resolving errors or bugs in your code to ensure it runs correctly. This guide will walk you through effective strategies for debugging your code, from understanding the error message to fixing the issue.
Enozom is a software development company known for creating high-quality solutions across different industries. Debug An Error in code is a key part of their work to ensure their software is strong and dependable. Their careful method includes looking at error messages, repeating the issues, and using advanced debugging tools. By pinpointing problems, checking their assumptions, and thoroughly testing fixes, Enozom makes sure their software works well and reliably, building trust and satisfaction with their clients.
1. Understanding the Error Message
Read the Error Message Carefully
The first step in debugging is to carefully read the error message. Error messages often provide vital clues about what went wrong and where. Here’s how to interpret them:
- Type of Error: Indicates what kind of error it is (e.g., syntax error, runtime error, logical error).
- Error Location: Points to the line number or function where the error occurred.
- Error Description: Describes the problem (e.g., “undefined variable”, “index out of bounds”).
Example
An error message like “IndexError: list index out of range” tells you that you’re trying to access an index in a list that doesn’t exist.
2. Reproduce the Error
Consistent Reproduction
Ensure you can consistently reproduce the error. This helps you understand the conditions under which the error occurs.
Simplify the Code
Try to simplify your code to isolate the problem. Remove unnecessary parts to focus on the core issue.
3. Use Debugging Tools
Print Statements
Adding print statements to your code can help you trace its execution and understand where things go wrong.
Integrated Development Environment (IDE) Debuggers
IDEs like PyCharm, Visual Studio Code, and Eclipse have built-in debuggers. These allow you to set breakpoints, step through code, and inspect variables.
Setting a Breakpoint
- Click in the gutter next to the line number where you want to set a breakpoint.
- Run the debugger.
- Use step commands to execute your code line by line.
Logging
For more complex applications, use logging to record information about your application’s execution.
4. Check for Common Issues
Syntax Errors
Ensure your code is syntactically correct. Most IDEs and text editors highlight syntax errors.
Logical Errors
Logical errors occur when your code runs but produces incorrect results. Check your algorithm and logic.
Runtime Errors
These occur during execution. Common causes include:
- Division by zero
- Null or undefined variables
- File I/O issues
5. Validate Your Assumptions
Use Assertions
Assertions are a way to test assumptions in your code. If an assertion fails, it raises an error.
Manual Checks
Manually verify that your inputs and outputs are as expected.
6. Isolate the Problem
Divide and Conquer
Break your code into smaller parts and test each part independently.
Binary Search Method
Use a binary search approach to narrow down the location of the bug by placing print statements or breakpoints at the middle of the suspected faulty code and checking both halves.
7. Seek Help
Documentation and Forums
Refer to the official documentation of the language or framework you’re using. Online forums like Stack Overflow can also be invaluable.
Pair Programming
Working with a colleague can provide a fresh perspective and help you spot errors you might have missed.
Rubber Duck Debugging
Explain your code and the problem to an inanimate object (like a rubber duck). This can help clarify your thinking and expose logical flaws.
8. Test Your Fix
Regression Testing
After fixing the error, ensure that your fix hasn’t introduced new bugs. Run your tests to verify the fix.
Unit Testing
Write unit tests for your functions to catch errors early.
Conclusion
Debug An Error is an iterative and sometimes challenging process, but with the right tools and techniques, you can efficiently identify and resolve errors in your code. Remember to stay patient, methodical, and curious. Each bug is an opportunity to learn and improve your problem solving skills.
